Profiling with Valgrind and visualization with KCachegrind
Profiling native code is certainly an interesting topic. Many people don’t do it at all, and some people overdo it (unnecessary micro optimization). Also there’s the problem of finding good (free) tools which are easy to use.
I write code on Windows, so that’s were I’m basing this article on. If you’re working on Linux, you’re probably familiar with the tools mentioned in the title anyway.
For native code there are basically two kinds of performance profiling approaches. One is to modify the code before it goes into the compiler to add instrumentation to some or all functions that need profiling. The second approach is to have an external tool either inject itself into the process or just monitor call stack samples of your running program.
The first one I have never seen a good practical solution. It might be acceptable if it were really well integrated into an IDE or compiler, and I could see data being more accurate that way. But in the end instrumentation always skews the numbers. But as long as its evenly affected, we’ll still end up knowing relatively whats slow and how changes affect the performance profile.
The easy way
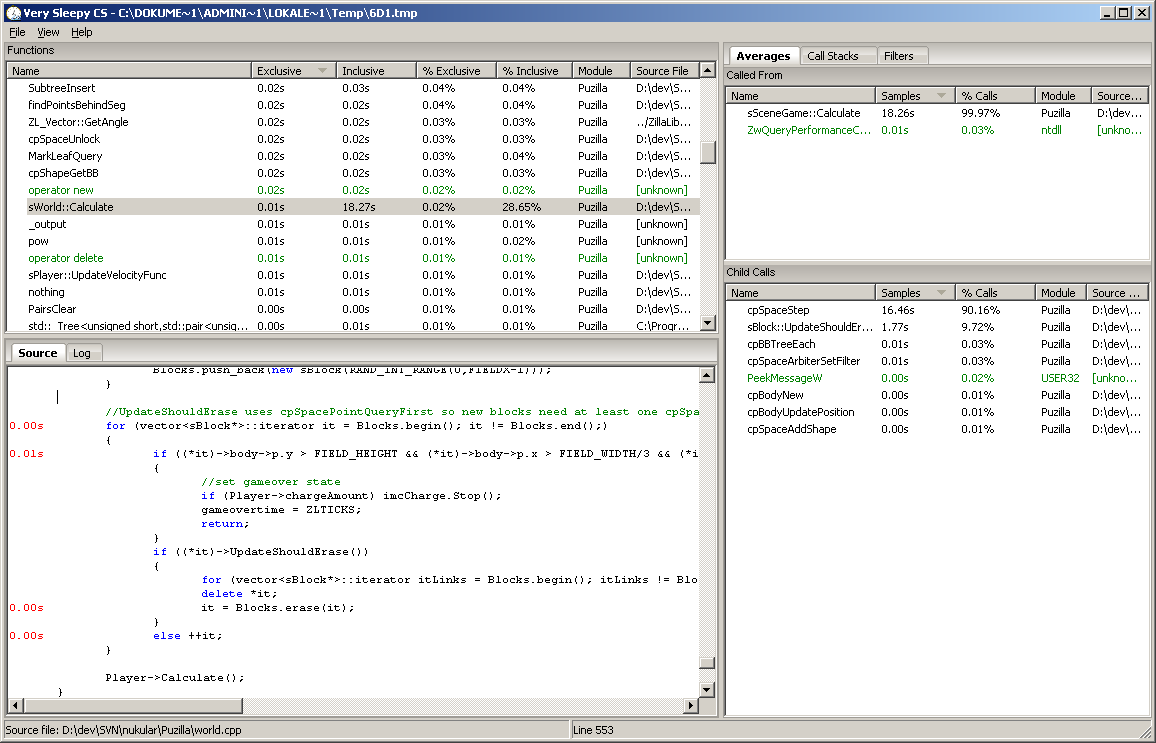
A really good simple and easy to use free performance profiler for Windows is Very Sleepy. It is very lightweight and attaches to any Windows process whose binaries have standard PDB debugging information next to it. One thing to watch out with these external profilers is to activate compiler optimizations and not just run a pure unoptimized debug build. Otherwise the output might show you things that are not relevant in a release build. In some older Visual C++ versions it didn’t output PDB along a release build per default so you might need to fiddle with the build settings.
The real way
Our actual goal here is to use the visualization tool KCachegrind which relies on profiling information created by the tool Callgrind from the analyzer suite Valgrind. These tools, by the way, are pronounced as “grinned” (rhymes with “tinned”) rather than “grined” (rhymes with “find”). Now the hard/sad part is, Valgrind depends on a lot of Unix stuff and won’t run on Windows so we need to go the other way. Now if your code you want to profile is absolutely dependent on Windows you might be out of luck. But in my case I try to keep the OS dependencies as low as possible for most native code I write. So we’re fast forwarding to where we’re up and running on Linux (or FreeBSD or MacOSX). For this little exercise I’m even just running Valgrind in a virtual machine. Which does work OK as the interesting numbers are all relative, even though running on real hardware would be preferred.
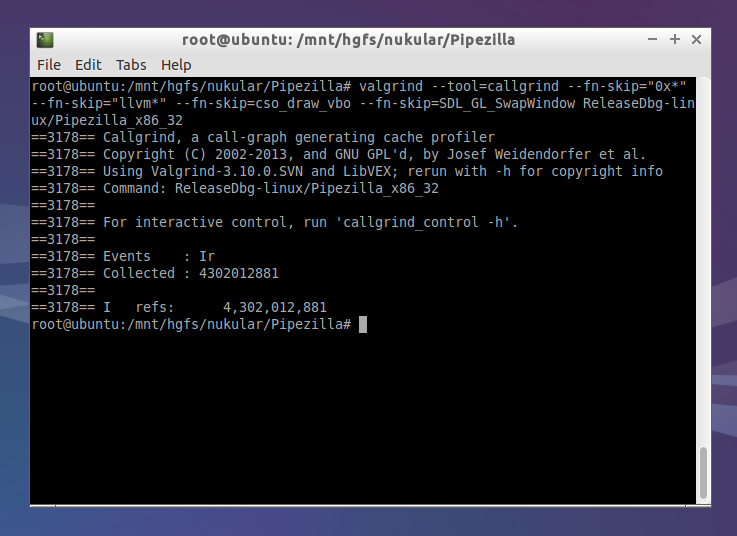 For this run I’m adding some
 --fn-skip parameters to remove function calls that are outside of my own code.
After finishing the run of your program Callgrind outputs a file named like callgrind.out.3176. The number in the file name is the process id, so it won’t override files of multiple runs.
Visualization!
Let’s get to the exciting part! Looking at the profiled code with the Windows build of KCachegrind, called QCachegrind. You can get the portable build over at its SourceForge project page.
Here’s how KCachegrind visualizes performance in a callgraph starting from any function:
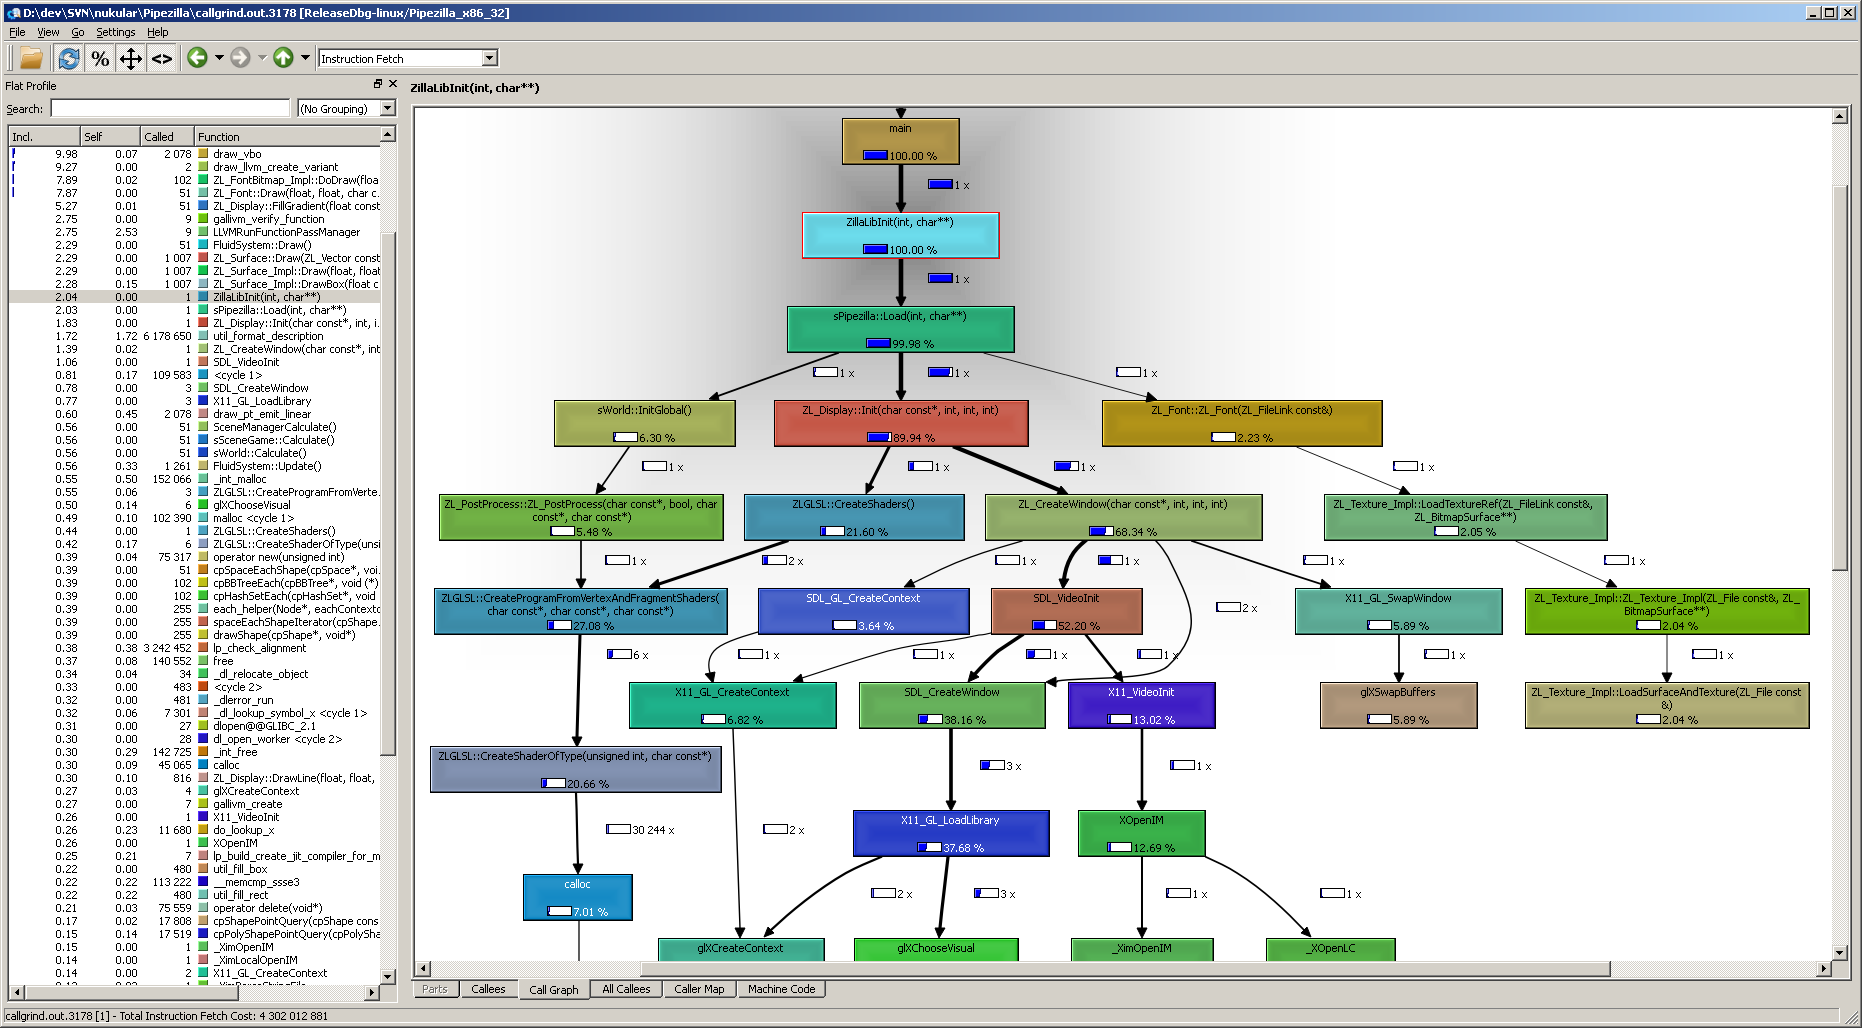
What a beatiful call graph! I activated the two settings Relative Cost and Relative to Parent, so the selected function always shows as 100%, and everything else in the graph relates to that. On top of that the graph can be heavily customized. We can set the depth of callers (functions above the selected one) and callees (functions below). Also the minimum cost percentage required to have things show up in the graph at all.
The UI of KCachegrind is a delight to use and to navigate. Any function in any view can be double clicked to switch the context and the panels and panes are customizable. Also it loads and runs very fast.
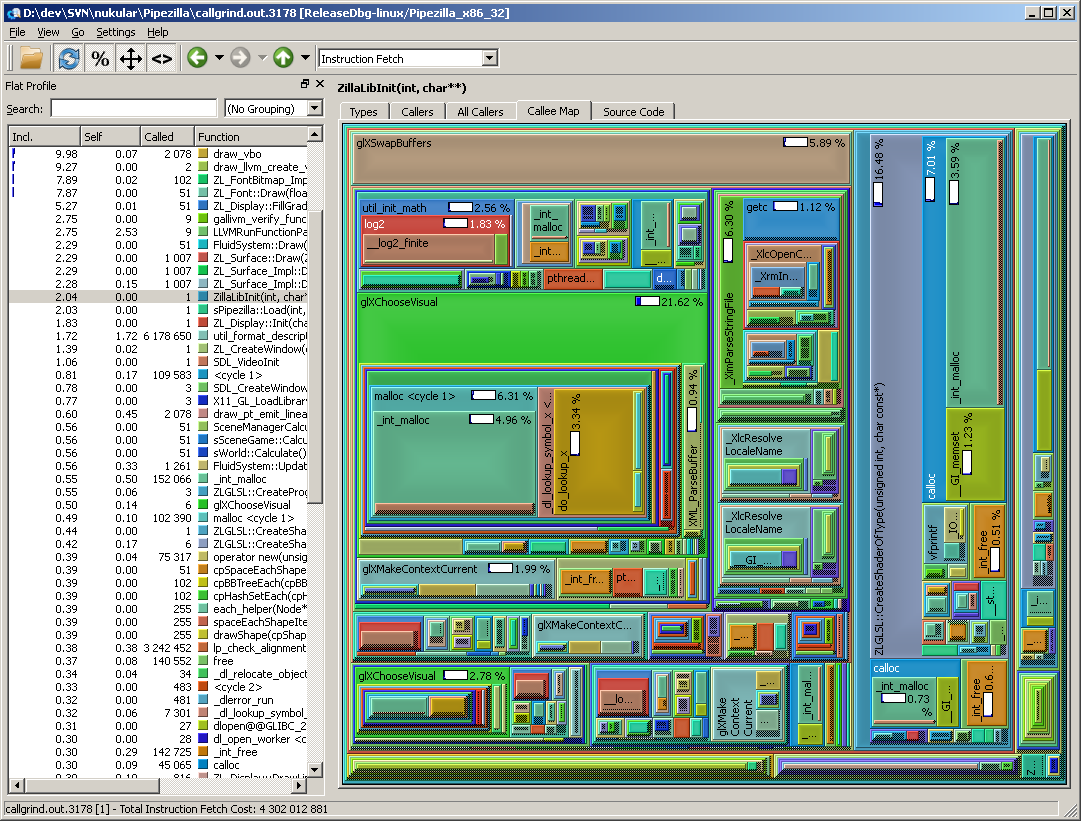 Whoa what a view! Although I rarely use the Callee Map when analyzing a profile, I love looking at it. Just like the call graph it has a bunch of options accessible by right clicking the view.
It just shows that there are many ways profiling data can be looked at with KCachegrind.
Whoa what a view! Although I rarely use the Callee Map when analyzing a profile, I love looking at it. Just like the call graph it has a bunch of options accessible by right clicking the view.
It just shows that there are many ways profiling data can be looked at with KCachegrind.
The other tabs have lists of callers and callees both only direct connections and full recursive.
Going deeper
So the last two views I wanted to show off are the source code and machine code views.
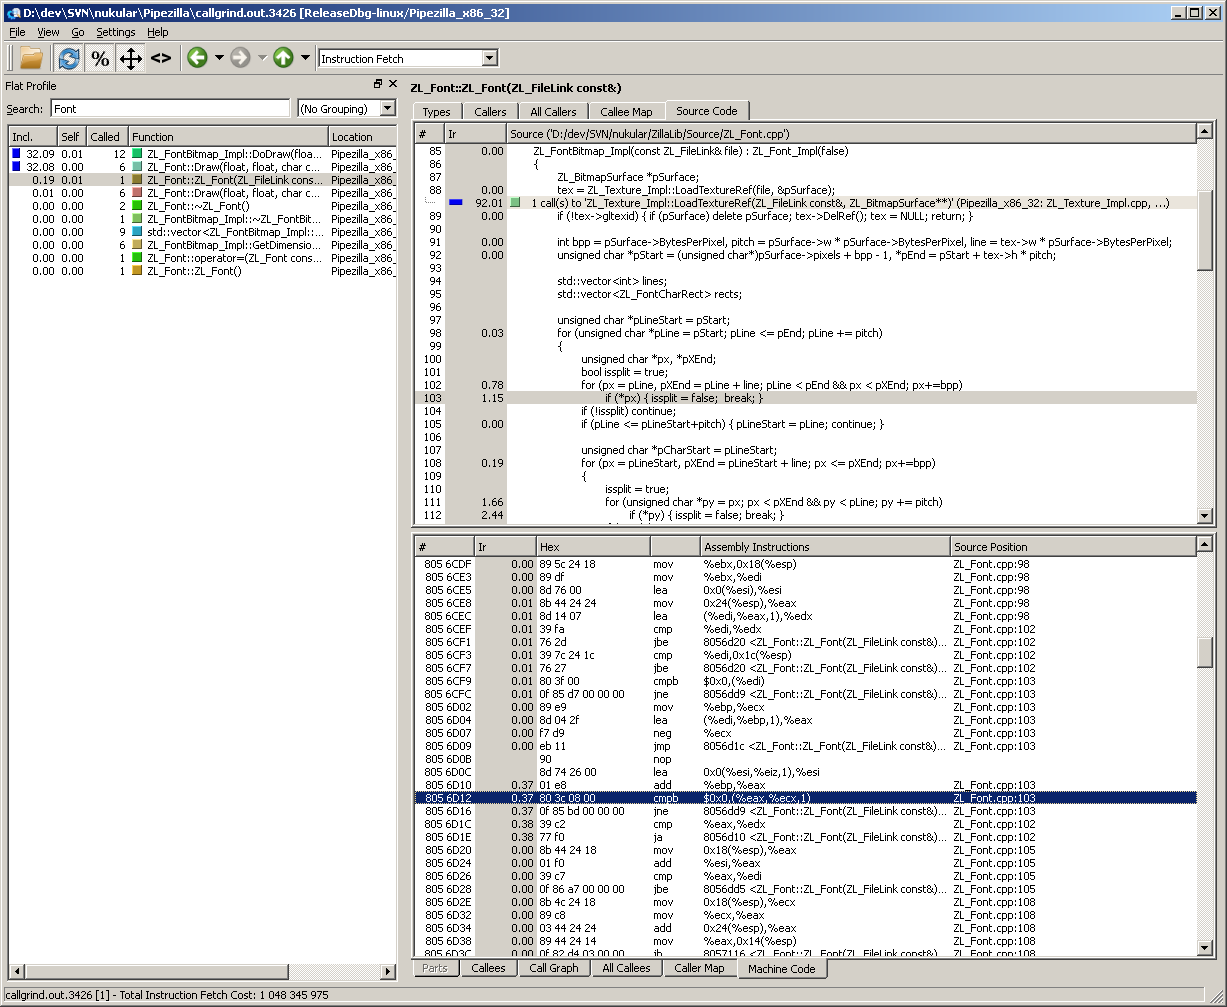
Unfortunately there is no code highlighting but the source code view is still very useful. The cool thing with having both source code view and machine code view open is that the cursors of the two views are synchronized. So scrolling through the lines in one view scrolls along in the other one. That makes it very easy to see how the compiler optimized our code, what was inlined or reordered. So helpful!
Getting the machine code view up and running on Windows is a bit tricky. First Callgrind needs to be run with the --dump-instr=yes option. Then QCachegrind checks the existence of the file name of the binary so you need to create the same path on Windows on the drive QCachegrind is running as was used when running Callgrind on Linux. Even an empty file having the same name and path as the used executable binary is fine.
The last part is the trickiest. KCachegrind uses the native objdump tool to fetch the machine code disassembly. Getting this up and running on Windows would be crazy, I think (probably requires building your own cross compile GCC suite). So I went another route. I created a tiny Windows command line application which all it does, is to call objdump over a PuTTY ssh connection as if it were run locally. Then I placed this Windows application into the QCachegrind directory and named it “objdump.exe”. And TADA, the machine code shows up! Check my other post about command line application tunneling for source and code further explanation.
Conclusion
Now this post has gotten quite long even without any actual advice on how to read the profiler output. But I think just seeing the possibilities coming from a good call graph generator and viewer can be quite eye opening. At least it was for me when I started to use this approach to performance profiling. Maybe in a future post I can get into more detail if I can find a good extractable example in my spare time programming code.